

Aurora
History of Aurora
On the summit of Cheat Mountain, the first settlement in Aurora was made in 1787 by the Reverend John Stough. John Wheeler moved to Aurora in 1800, while other families continued to settle nearby. Originally a German settlement, the town was named Salem and later became Mount Carmel. The current name, Aurora, was suggested because of the town's high altitude.
Aurora Today: What Makes Us Unique
 Cathedral State Park
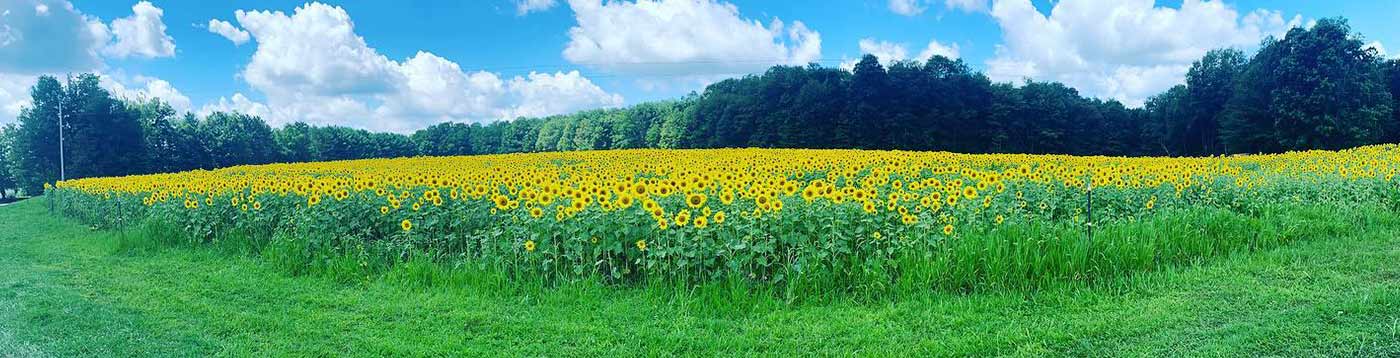
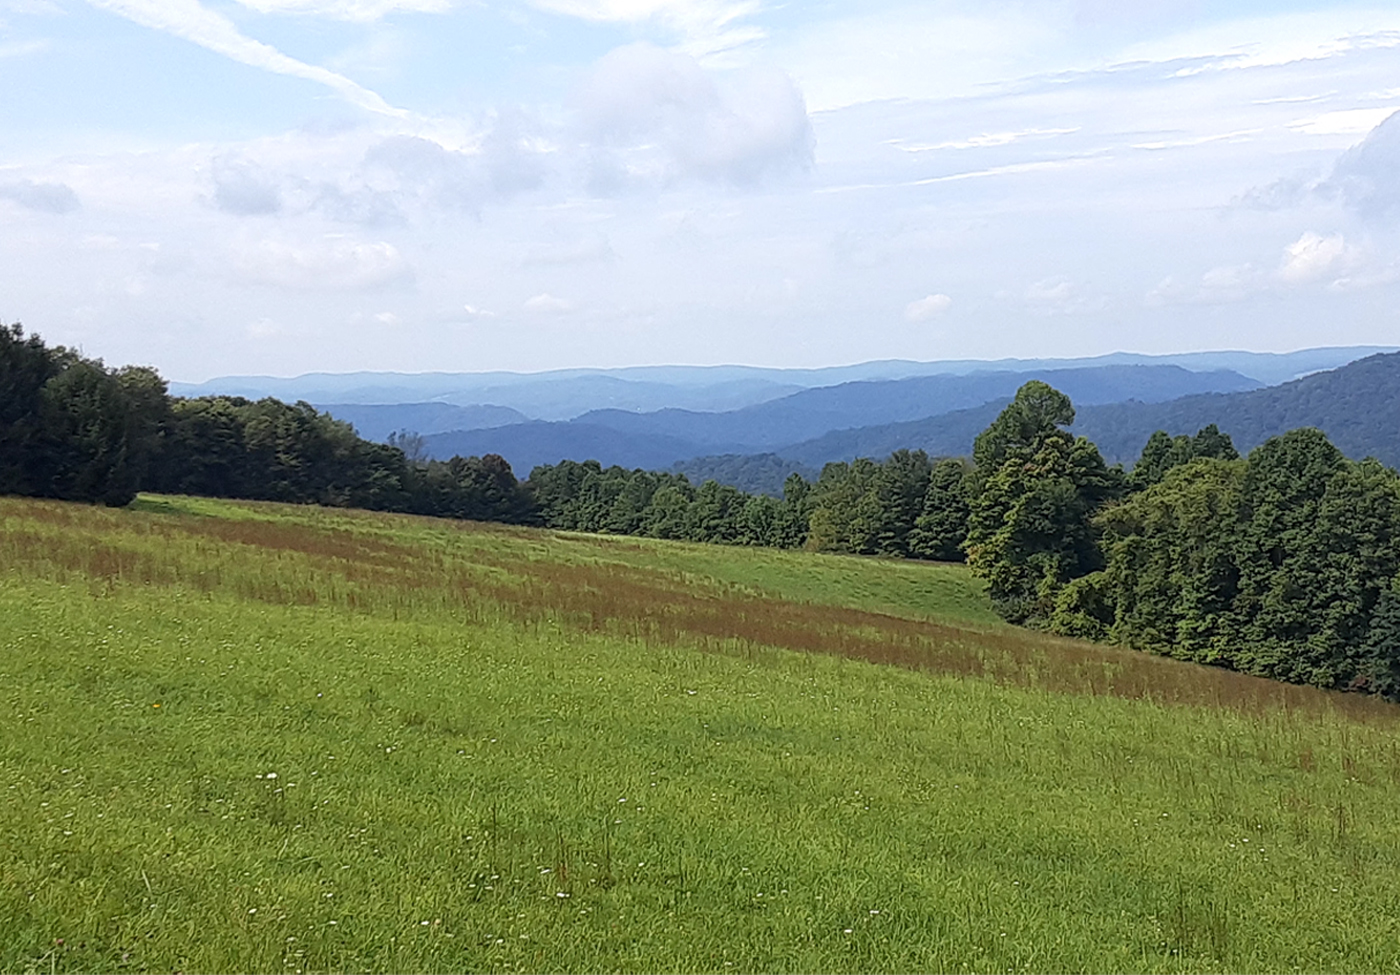
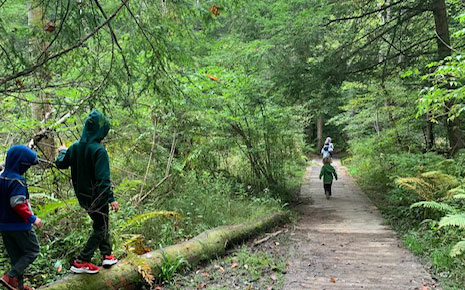
Located on the summit of Cheat Mountain, Aurora is a prime spot for visitors attracted to its high altitude and crisp, clean air, gentle rolling mountains and deep forests. Designated a National Natural Landmark, Cathedral State Park is West Virginia’s largest old-growth forest and is home to one of the largest stands of virgin hemlock in the state. Hiking through the 133-acre park offers miles of trails, original photography opportunities against endless varieties of flowers and trees.
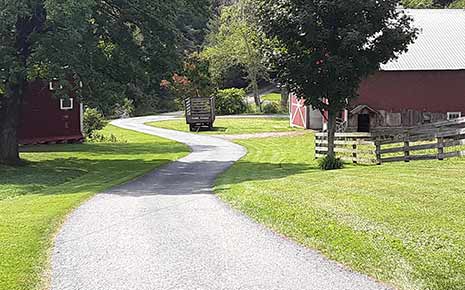
 Farming
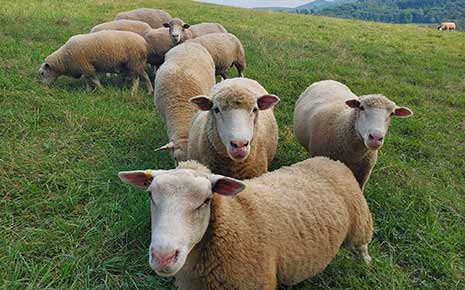
Preston County boasts over 1000 small family farms. Farming and timber have been part of the solid foundation of Aurora. Dairy farms, beef cattle, crops, and sheep farms are all located in this area. Local foods are abundant in Aurora and around Preston County.
The logging companies in the Aurora area and around Preston County responsibly harvest trees for the hardwoods industry and maintain the natural forests in the area.
 Jacob’s Ladder
Drawing its name from the area's high altitude, Jacob's Ladder addiction treatment community is nested in the gentle rolling mountains, forest, and pasture of Aurora. The unique setting allows for historical farming and forestry practices to be integral pieces of the healing allowed for here. The Netflix documentary, “The Recovery Boys” was filmed here.
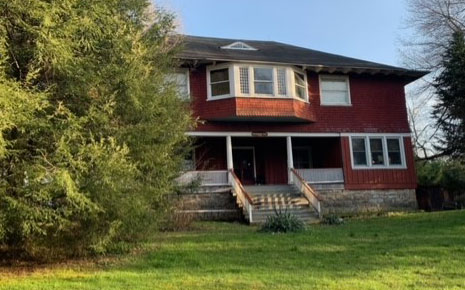 Brookside Inn
Built near the turn of the nineteenth century as part of a resort complex for those seeking to escape the busy city life of the East Coast, the Brookside Inn maintains the hospitality, spirit and traditions of those times. The cozy retreat is on the National Register of Historic Places.
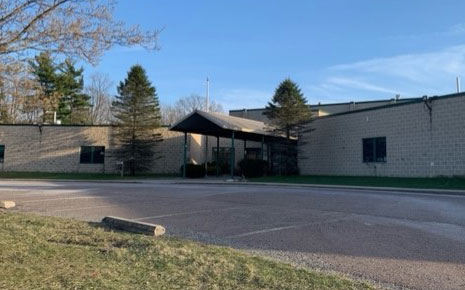 Aurora School
Aurora is proud of its Aurora School, which serves students in prekindergarten through eighth-grade.
Population
Population
| Population | 2000 | 2010 | 2023 | 2028 |
|---|---|---|---|---|
| Aurora | 225 | 212 | 190 | 181 |
Source: ESRI, 2023-10-17
Population by Age
| Population | 2010 | 2023 | 2028 |
|---|---|---|---|
| 0-4 | 9 | 4 | 4 |
| 5-9 | 8 | 10 | 8 |
| 10-14 | 13 | 9 | 8 |
| 15-19 | 14 | 1 | 14 |
| 20-24 | 9 | 8 | 0 |
| 25-29 | 11 | 12 | 12 |
| 30-34 | 9 | 7 | 10 |
| 35-39 | 12 | 12 | 9 |
| 40-44 | 15 | 5 | 11 |
| 45-49 | 15 | 12 | 12 |
| 50-54 | 21 | 16 | 9 |
| 55-59 | 20 | 11 | 13 |
| 60-64 | 13 | 21 | 12 |
| 65-69 | 14 | 29 | 17 |
| 70-74 | 9 | 9 | 20 |
| 75-79 | 9 | 14 | 8 |
| 80-84 | 6 | 5 | 7 |
| 85+ | 5 | 5 | 7 |
| 18+ | 173 | 167 | 151 |
| Median Age | 47 | 55 | 51 |
Source: ESRI, 2023-10-17
Population by Race
| Aurora | 2023 |
|---|---|
| Total | 190.00 |
| White Alone | 96.84 |
| Black Alone | 0.00 |
| American Indian Alone | 0.00 |
| Asian Alone | 0.00 |
| Pacific Islander Alone | 0.00 |
| Some Other Race | 0.53 |
| Two or More Races | 2.63 |
| Hispanic Origin | 1.58 |
| Diversity Index | 9.10 |
Source: ESRI, 2023-10-17
Growth Rate
| Aurora | 2023 - 2028 |
|---|---|
| Population | -0.97% |
| Households | -0.50% |
| Families | -0.37% |
| Median Household Income | -2% |
| Per Capita Income | 3% |
Source: ESRI, 2023-10-17
Back To TopHousing
Households
| Population | 2000 | 2010 | 2023 | 2028 |
|---|---|---|---|---|
| Households | 86 | 89 | 81 | 79 |
| Housing Units | 91 | 95 | 92 | 92 |
| Owner Occupied Units | 72 | 71 | ||
| Renter Occupied Units | 9 | 8 | ||
| Vacant Units | 11 | 13 |
Source: ESRI, 2023-10-17
Home Value
| Aurora | 2023 | 2028 |
|---|---|---|
| Median Home Value | $110,000 | $185,000 |
| Average Home Value | $127,778 | $216,901 |
| <$50,000 | 27 | 6 |
| $50,000 - $99,999 | 7 | 10 |
| $100,000 - $149,999 | 10 | 9 |
| $150,000 - $199,999 | 14 | 15 |
| $200,000 - $249,999 | 4 | 5 |
| $250,000 - $299,999 | 4 | 5 |
| $300,000 - $399,999 | 4 | 12 |
| $400,000 - $499,999 | 2 | 9 |
| $500,000 - $749,999 | 0 | 0 |
| $1,000,000 + | 0 | 0 |
Source: ESRI, 2023-10-17
Housing Year Built
| Year Range | Houses Built |
|---|---|
| 2010 or Later | 2 |
| 2000-2009 | 9 |
| 1990-1999 | 4 |
| 1980-1989 | 16 |
| 1970-1979 | 12 |
| 1960-1969 | 1 |
| 1950-1959 | 3 |
| 1940-1949 | 6 |
| 1939 or Before | 24 |
Source: ESRI, 2023-10-17
Back To TopIncome
Income
| Aurora | 2023 | 2028 |
|---|---|---|
| Median Household | $56,817 | $51,828 |
| Average Household | $62,909 | $69,992 |
| Per Capita | $26,819 | $30,549 |
Source: ESRI, 2023-10-17
Household Income Base
| Aurora | 2023 |
|---|---|
| <$15,000 | 7 |
| $15,000 - $24,999 | 6 |
| $25,000 - $34,999 | 5 |
| $35,000 - $49,999 | 15 |
| $50,000 - $74,999 | 20 |
| $75,000 - $99,999 | 14 |
| $100,000 - $149,999 | 13 |
| $150,000 - $199,999 | 0 |
| $200,000+ | 1 |
Source: ESRI, 2023-10-17
Back To TopEmployees
Commute
| Category | Commuters |
|---|---|
| Workers 16+ | 62 |
| In-County Residents | 19 |
| Out-of-County Residents | 10 |
| Drive Alone | 46 |
| Carpooled | 11 |
| Public Transport | 0 |
| Work at Home | 0 |
| Less than 5 minutes | 4 |
| 5-9 minutes | 1 |
| 10-14 minutes | 0 |
| 15-19 minutes | 5 |
| 20-24 minutes | 7 |
| 25-29 minutes | 12 |
| 30-34 minutes | 12 |
| 35-39 minutes | 1 |
| 40-44 minutes | 1 |
| 45-59 minutes | 12 |
| 60-89 minutes | 6 |
| 90+ minutes | 0 |
| Average Travel Time | 0 |
Source: ESRI, 2023-10-17
Source: ESRI, 2023-10-17
Employees by NAICS
| Category | Number |
|---|---|
| Total Employees | 63 |
| Agr/Forestry/Fish/Hunt | 0 |
| Mining | 0 |
| Utilities | 0 |
| Construction | 0 |
| Manufacturing | 0 |
| Wholesale Trade | 0 |
| Retail Trade | 17 |
| Motor Veh/Parts Dealers | 0 |
| Furn & Home Furnish Str | 0 |
| Electronics & Appl Store | 0 |
| Bldg Matl/Garden Equip | 9 |
| Food & Beverage Stores | 1 |
| Health/Pers Care Stores | 0 |
| Gasoline Stations | 0 |
| Clothing/Accessory Store | 0 |
| Sports/Hobby/Book/Music | 0 |
| General Merchandise Str | 7 |
| Misc Store Retailers | 0 |
| Nonstore Retailers | 0 |
| Transportation/Warehouse | 5 |
| Information | 0 |
| Finance & Insurance | 3 |
| Cntrl Bank/Crdt Intrmdtn | 3 |
| Sec/Cmdty Cntrct/Oth Inv | 0 |
| Insur/Funds/Trusts/Other | 0 |
| Real Estate/Rent/Leasing | 1 |
| Prof/Scientific/Tech Srv | 0 |
| Legal Services | 0 |
| Mgmt of Comp/Enterprises | 0 |
| Admin/Support/Waste Mgmt | 5 |
| Educational Services | 0 |
| HealthCare/Social Assist | 16 |
| Arts/Entertainment/Rec | 7 |
| Accommodation/Food Srvcs | 0 |
| Accommodation | 0 |
| Food Srv/Drinking Places | 0 |
| Other Srv excl Pub Admin | 9 |
| Auto Repair/Maintenance | 2 |
| Public Administration Emp | 0 |
Source: ESRI, 2023-10-17
Educational Attainment (25+)
| Aurora | 2023 |
|---|---|
| Some High School | 5 |
| Graduated High School | 73 |
| Associates Degree | 1 |
| Bachelor's Degree | 22 |
| Graduate Degree | 6 |
Source: ESRI, 2023-10-17
Back To TopBusinesses
Businesses by NAICS
| Category | Number |
|---|---|
| Total Businesses | 12 |
| Agr/Forestry/Fish/Hunt Bus | 0 |
| Mining Bus | 0 |
| Utilities Bus | 0 |
| Construction Bus | 0 |
| Manufacturing Bus | 0 |
| Wholesale Trade Bus | 0 |
| Retail Trade Bus | 3 |
| Motor Veh/Parts Dealers Bus | 0 |
| Furn & Home Furnish Str Bus | 0 |
| Electronics & Appl Store Bus | 0 |
| Bldg Matl/Garden Equip Bus | 1 |
| Food & Beverage Stores Bus | 1 |
| Health/Pers Care Stores Bus | 0 |
| Gasoline Stations Bus | 0 |
| Clothing/Accessory Store Bus | 0 |
| Sports/Hobby/Book/Music Bus | 0 |
| General Merchandise Str Bus | 1 |
| Misc Store Retailers Bus | 0 |
| Nonstore Retailers Bus | 0 |
| Transportation/Warehouse Bus | 1 |
| Information Bus | 0 |
| Finance & Insurance Bus | 1 |
| Cntrl Bank/Crdt Intrmdtn Bus | 1 |
| Sec/Cmdty Cntrct/Oth Inv Bus | 0 |
| Insur/Funds/Trusts/Other Bus | 0 |
| Real Estate/Rent/Leasing Bus | 1 |
| Prof/Scientific/Tech Srv Bus | 0 |
| Legal Services Bus | 0 |
| Mgmt of Comp/Enterprises Bus | 0 |
| Admin/Support/Waste Mgmt Bus | 1 |
| Educational Services Bus | 0 |
| HealthCare/Social Assist Bus | 1 |
| Arts/Entertainment/Rec Bus | 1 |
| Accommodation/Food Srvcs Bus | 0 |
| Accommodation Bus | 0 |
| Food Srv/Drinking Places Bus | 0 |
| Other Srv excl Pub Admin Bus | 3 |
| Auto Repair/Maintenance Bus | 1 |
| Public Administration Bus | 0 |
Source: ESRI, 2023-10-17
Back To Top